
Natural disasters have significantly affected millions of people across the world. Shattering floods and landslides have buried millions of homes, and wildfires have caused havoc on fertile lands. Natural disasters' yearly occurrence raises questions, and environmental experts have continually reiterated it's due to human activities on our planet. While its effects have made themselves visible over time, many people still don’t believe that climate change is real. Well, it’s so genuine, and we’ve got some proof!
Just recently, NASA shared a series of photos to show how drastic human activity has affected Planet Earth. Titled Images of Change, the series tells the tale of receding ice shelves, dried up seas, deforestation, extreme droughts, melting glaciers, among others. We’ve compiled 20 of the images, and they’re evidence that climate change is real and is happening. A few of these aerial comparison photos of places will leave startled. Please have a look, and it’s indeed high time will start being eco-friendly.
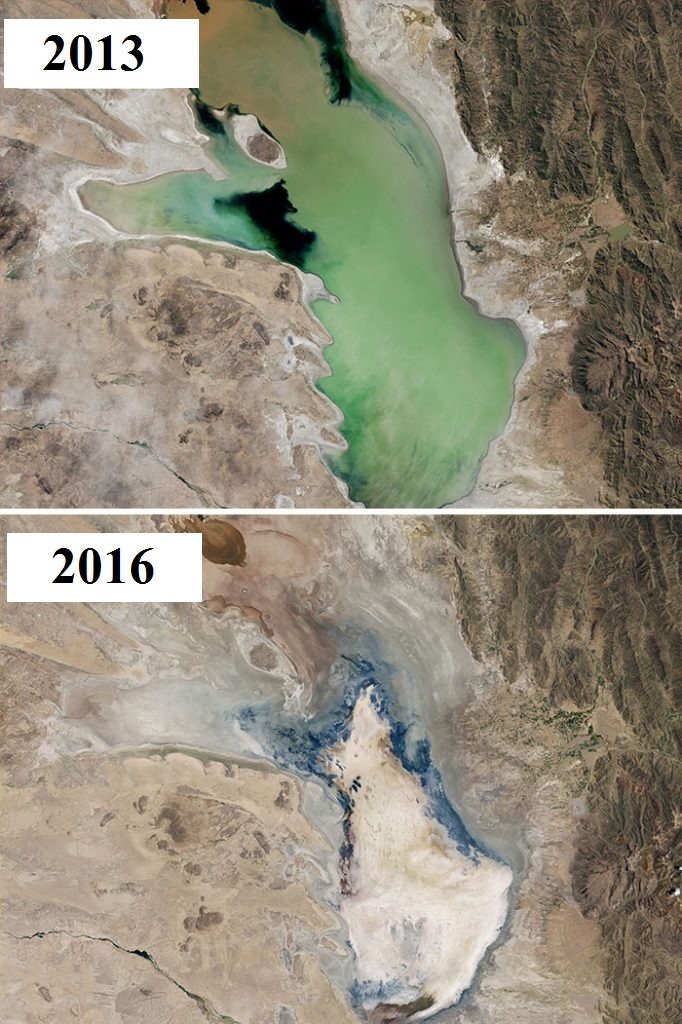
The Drying Lake Poopo In Bolivia (2013 Vs. 2016)
Images of Change -Via
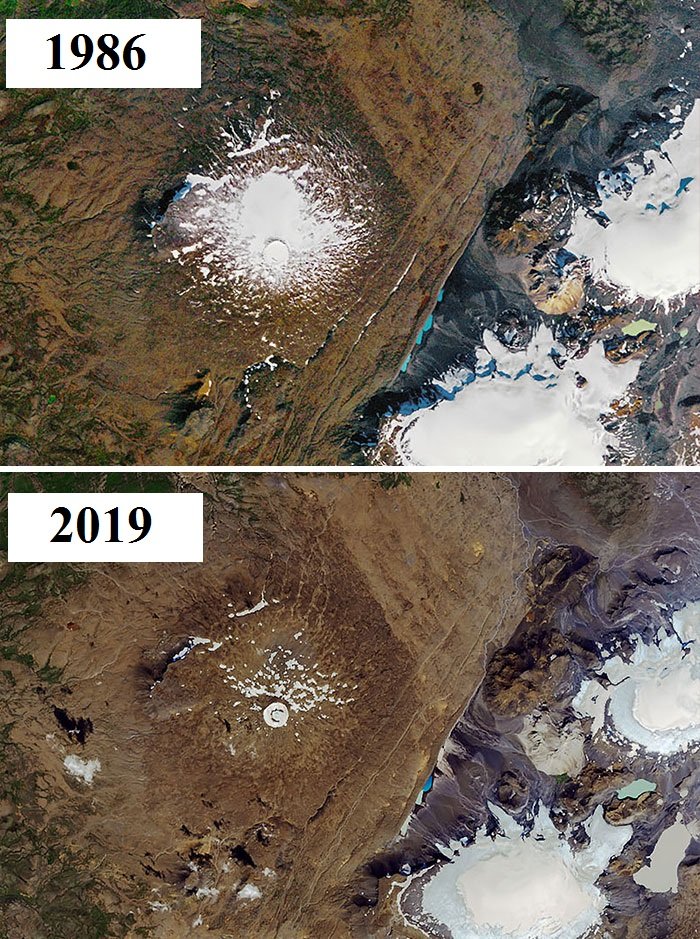
'Lake Poopó, Bolivia’s second-largest lake and an important fishing resource for local communities, has dried up once again because of drought and diversion of water sources for mining and agriculture. The last time it dried was in 1994, after which it took several years for water to return and even longer for ecosystems to recover. In wet times, the lake has spanned an area approaching 1,200 square miles (3,000 square kilometers). Its shallow depth—typically no more than 9 feet (3 meters)—makes it particularly vulnerable to fluctuations.'Okjokull, The Melting Icelandic For Glacier (1986 Vs. 2019)
Images of Change -Via
'These images show the latter stages of the decline of Okjökull, a melting glacier atop Ok volcano in west-central Iceland. (“Jökull” is Icelandic for “glacier.”) A 1901 geological map estimated that Okjökull spanned about 15 square miles (38 square kilometers). In 1978, aerial photography showed the glacier had shrunk to about 1 square mile (3 square kilometers). Today, less than half a square mile (less than 1 square kilometer) remains.'The Beach Erosion Near Freeport Texas (2013 Vs. 2018)

Images of Change -Via
'These images show an area just south of Freeport, Texas, where the beach is being lost at a rate of nearly 49 feet (15 meters) per year along an 11-mile (17-kilometer) stretch. It is one of the largest erosive hotspots in the world. A team of researchers from the Netherlands used Landsat satellite data to track changes in sandy beaches worldwide from 1984 to 2016. They found that 24 percent of the beaches eroded more than 20 inches (0.5 meters) per year, including more than a third of those classified as protected. Some 28 percent of sandy beaches grew, and 48 percent remained stable.'Australia’s Tanami Desert Fires ( Before Vs. After)

Images of Change -Via
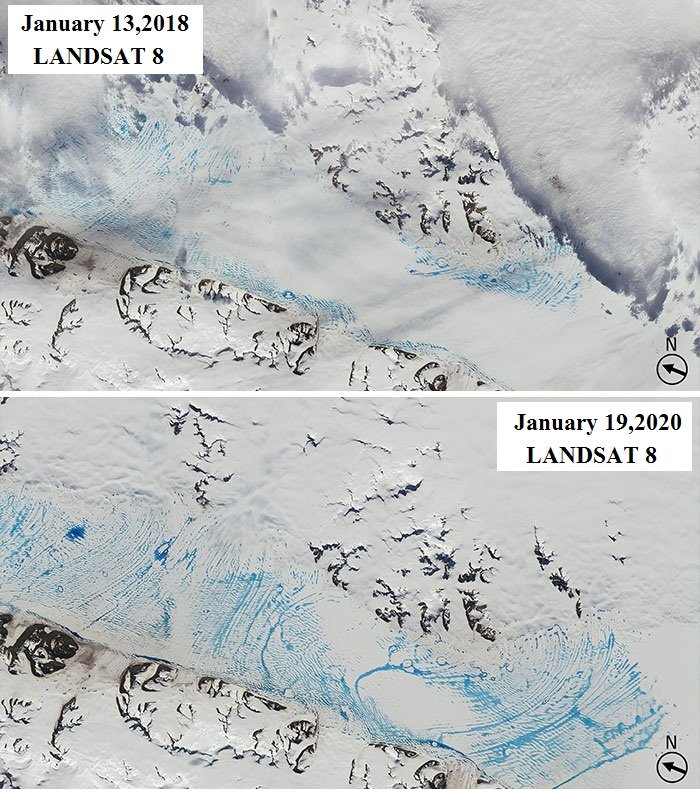
'Arid conditions have led to major fires in north-central Australia during the past year. In February, fires along the coast caused extensive damage and loss of life. More recently, dry conditions fed many fires in Australia's least populated area, the Tanami Desert region, which is about the size of Texas and Iowa combined. Vegetation on its sand ridges and plains is limited largely to short grasses and shrubs. The September 7 satellite image shows scars (dark area) from previous fires. The September 23 image shows further scarring from active fires.'The Record Pools Of Meltwater On George Vi Ice Shelf In Antarctica (2018 Vs. 2020)
Images of Change -Via
'Even in frigid Antarctica, depressions in the surface of a glacier can fill with meltwater during the relative warmth of summer. The blue areas in the 2020 image represent the most widespread meltwater pooling — spanning some 90 miles (140 kilometers) — ever recorded on the George VI Ice Shelf. This massive slab of glacier ice protrudes from the Antarctic Peninsula's western side and floats on the waters separating the peninsula from Alexander Island. Pools like these can destabilize ice shelves, but George VI is thought to be robust enough to withstand them.'The Disappearing Hawaiian Island (Before Vs. After)

Images of Change -Via
'Until Hurricane Walaka struck in October 2018, the Northwestern Hawaiian Islands included East Island, shown in the September image. But the storm washed away most of the 11 acres of sand and gravel that constituted the island, leaving only two slivers of land, visible in the October image. East Island was part of the French Frigate Shoals, an atoll in the Papahānaumokuākea Marine National Monument.'Heavy Rains Flood In Peru (2016 Vs. 2017)

Images of Change -Via
'Heavy rains that began in mid-March 2017 have devastated much of Peru. According to reports, more than 70,000 people lost their homes, and more than 60 people died in floods and mudslides. Both the Lago La Niña and Piura River have overflowed their banks. Official data report that about 4,660 miles (7,500 km) of roads and 509 bridges have been damaged. In these false-color images, clouds and salt pans (depressions in the ground in which saltwater evaporates, leaving the salt behind) appears light blue.'Powerful Windstorm ‘Derecho’ Damages Iowa Crops
Images of Change -Via
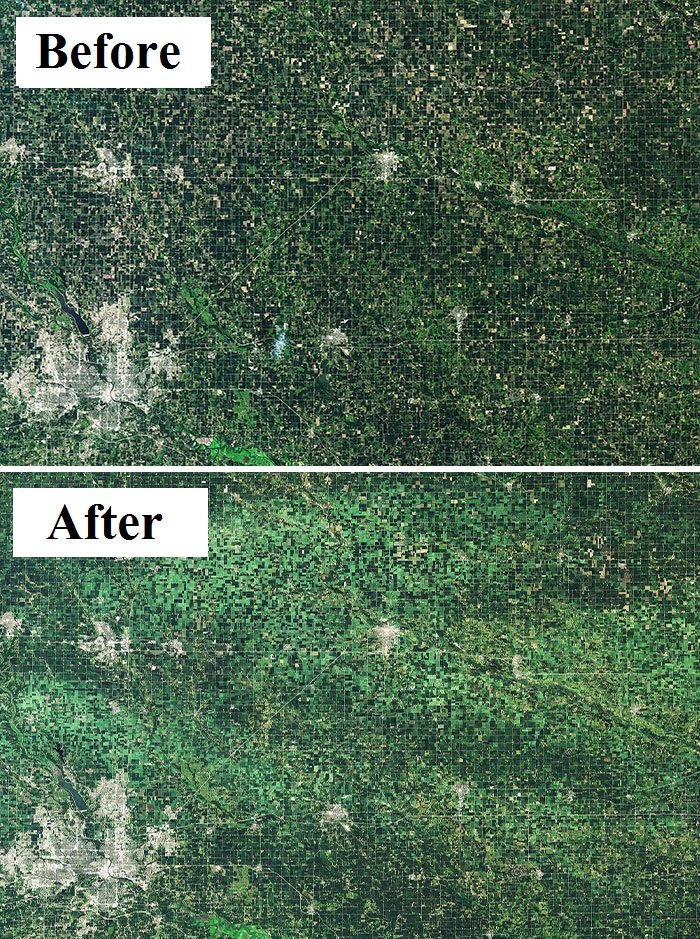
'A powerful windstorm, known as a derecho, tore across Iowa, northern Illinois, and northern Indiana on Aug. 10, 2020, with hurricane-force winds of 75 mph (120 kph) or more. According to the National Weather Service, Eastern Iowa saw gusts of up to 115 mph (185 kph). These images show fields of corn and soybeans in that state, before and after the storm. The lighter greens of the August image indicate crops that the winds damaged.'Glaciers Lose Mass Worldwide But The Bruggen Glacier Advances For No Clear Reason (1986 Vs. 2016)

Images of Change -Via
'Many of the world’s glaciers are losing mass and receding, such as those in Chile’s Southern Patagonia Icefield (SPI). However, one of SPI’s glaciers, the Brüggen Glacier (also known as the Pio XI Glacier), is advancing for no clear reason. Between 1998 and 2014, the glacier’s southern front advanced 593 meters (about 1,945 feet), and its northern front, which flows into Lake Greve, advanced 107 meters (about 351 feet). Scientists theorize that activity inside or beneath the glacier could be making it advance, along with factors like flow speed and the lake’s depth. Whatever the cause, the SPI glaciers continue to be closely monitored from space.'The Bering Sea Ice Now Records Low (2013 Vs. 2018)
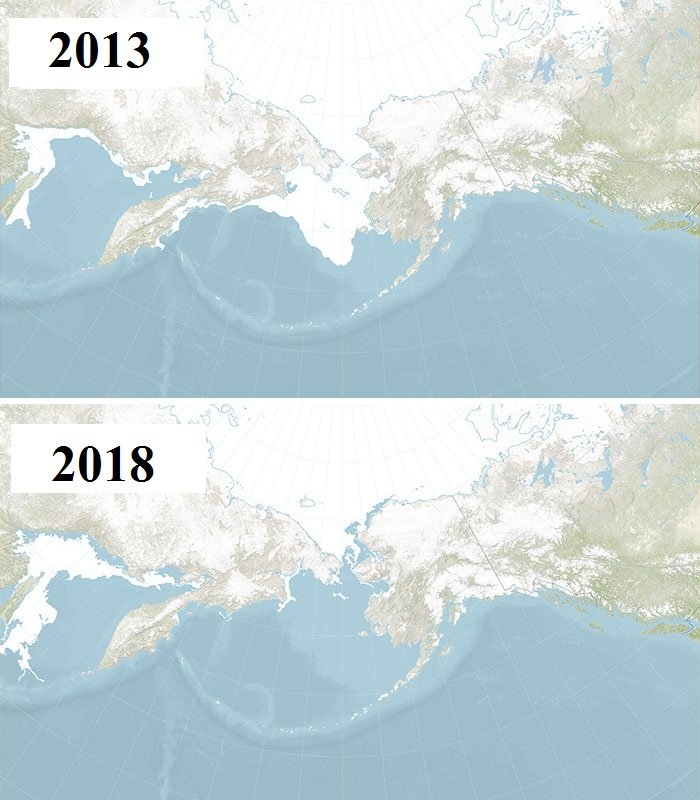
Images of Change -Via
'Less ice formed in the Bering Sea during the winter of 2017-18 than in any winter since the start of written records in 1850. Normally, ice covers more than 193,000 square miles (500,000 square kilometers) of the sea in late April, roughly twice Texas's size. The ice extent at that time in 2018 was only about 10 percent of normal. Changes in when and where the sea ice melts can affect phytoplankton blooms, which, in turn, can affect the entire Bering ecosystem. Further, open water absorbs more of the Sun’s energy than ice, which contributes to the planet’s warming'Rare Snow Falls Surfaced At The Edge Of Sahara Desert
Images of Change -Via
'Snow fell on the edge of northwest Africa’s Sahara Desert in mid-December 2016, a rarity for the area. The Landsat 7 satellite’s Enhanced Thematic Mapper Plus (ETM+) sensor captured a white left image over a caramel-colored landscape southwest of the Algerian community Ain Sefra, a town sometimes referred to as the gateway to the desert. All of the snow disappeared except at the highest elevations, as shown in the right image captured by Landsat 8. Ain Sefra’s last snowfall occurred in February 1979.'The Arctic Sea Ice Coverage Records Hits Low (1984 Vs. 2012)
Images of Change -Via
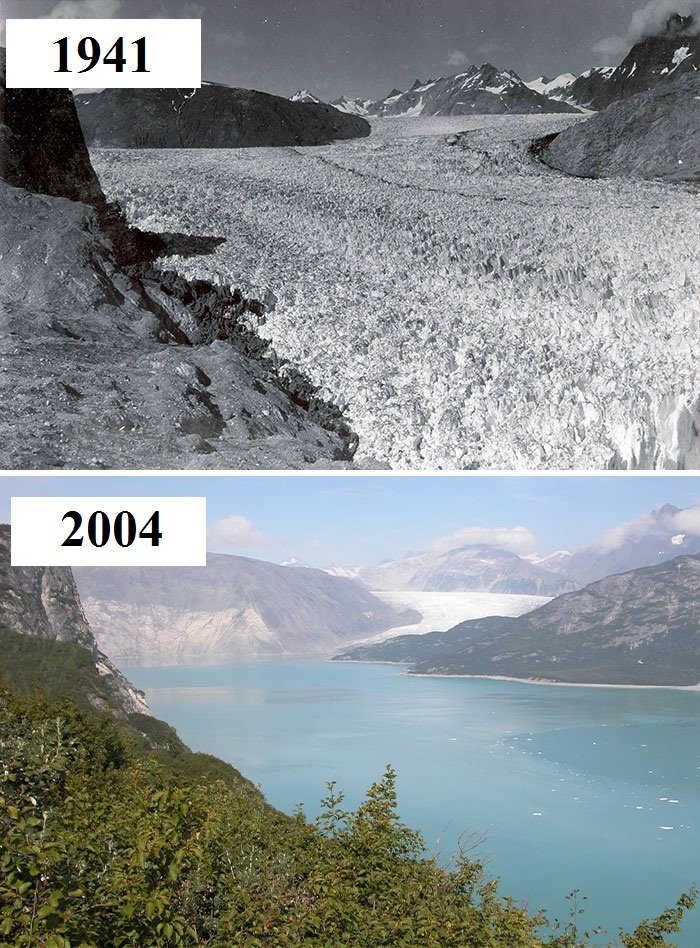
'The 1941 photograph shows the lower reaches of Muir Glacier and its tributary, Riggs Glacier. The two glaciers filled Muir Inlet. In the 2004 photograph, Muir Glacier, continuing a retreat nearly two centuries-long, is located about 4 miles (7 kilometers) to the northwest, out of the field of view. Riggs Glacier has retreated some 0.4 miles (0.6 kilometers). Both glaciers have thinned substantially.'Drought In Utah, Arizona And Lake Powell (1999 Vs. 2014)

Images of Change -Via
'Prolonged drought coupled with water withdrawals have caused a dramatic drop in Lake Powell's water level. These images show the lake's northern part, a deep, narrow, meandering reservoir that extends from Arizona upstream into southern Utah. The 1999 image shows water levels near full capacity. By May 2014, the lake had dropped to 42 percent of capacity.'The Arctic Sea Ice Coverage Records Hits Low (1984 Vs. 2012)
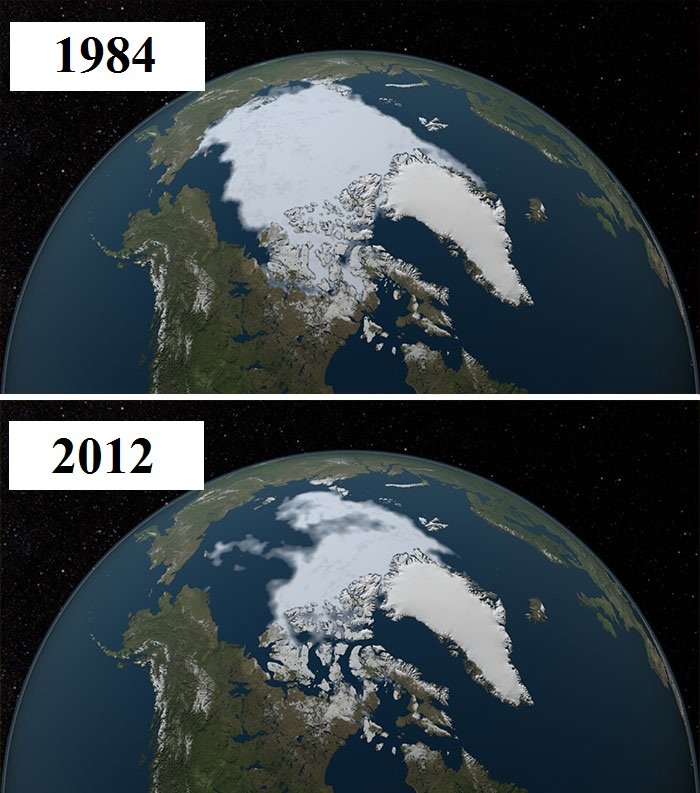
Images of Change -Via
'The Arctic Ocean area covered in ice increases during the winter and then shrank during the summer, usually reaching the year’s low point in September. 'The minimum coverage for 2012 set a record low since 1979 when the first reliable satellite measurements began. These images compare the 1984 minimum, which was roughly equal to the average minimum extent for 1979–2000, with that of 2012, when the minimum was about half. The 2013 minimum was larger but continued the long-term downward trend of about 12 percent sea-ice loss per decade since the late 1970s, a decline that accelerated after 2007. The 2016 minimum was tied for the second-lowest on record. “At the rate, we’re observing this decline,” said NASA scientist Joey Comiso, 'likely, the Arctic’s summer sea ice will completely disappear within this century.'The Ice and Rock Avalanche In Tibet’s Aru Range

Images of Change -Via
'The collapse of a glacier tongue on July 17, 2016, sent a huge stream of ice and rock tumbling down a narrow valley in Tibet’s Aru Range. Nine people in the remote village of Dungru were killed along with their herds of 350 sheep and 110 yaks. The ice avalanche, one of the largest ever recorded, left debris as much as 98 feet (30 meters) thick across 4 square miles (10 square kilometers). The reason for the collapse has so far eluded glaciologists.'The Kaskawulsh Glacier Meltwater Alters Downstream Ecosystems (2015 Vs. 2016)

Images of Change -Via
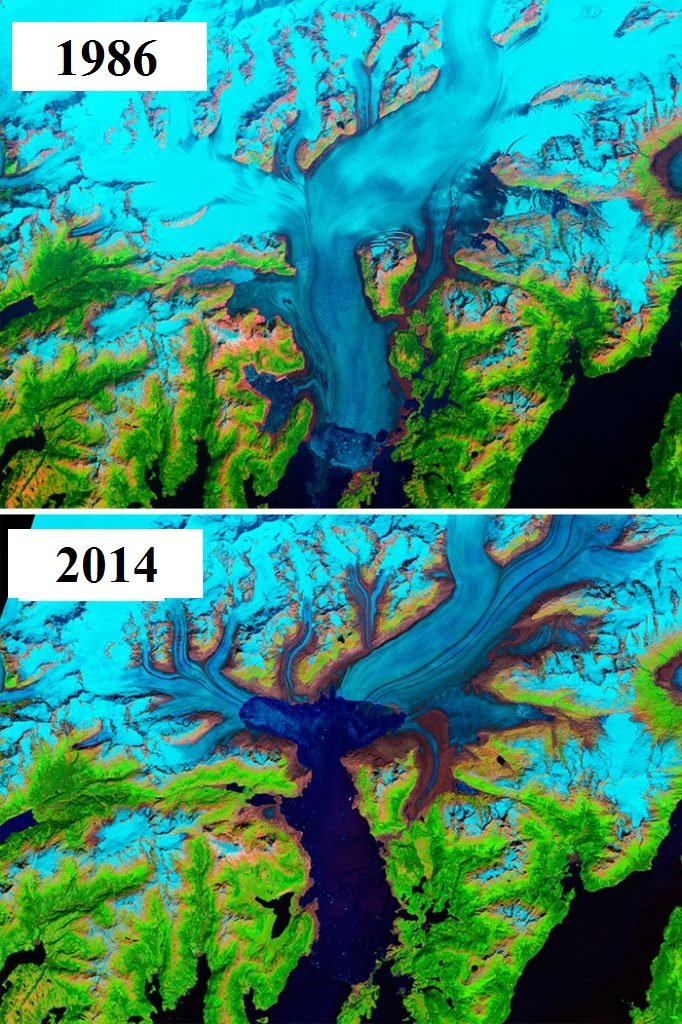
'Like most glaciers worldwide, Kaskawulsh Glacier in the Kluane National Park and Reserve of southwestern Yukon Territory, Canada, has receded over several decades. A Nature Geoscience article confirms that this receding glacier caused a rare instance of river piracy—the diversion of one stream’s headwaters into another. Instead of flowing north via the Slims River into Kluane Lake, eventually reaching the Yukon River and the Bering Sea as it did before spring 2016, most of the meltwater now flows eastward to the Alsek River and the Pacific Ocean via the Kaskawulsh River. This diversion brought sediment changes, varied timing of flows from the glacier and water level changes to the channels, possibly permanently altering downstream ecosystems.'The Columbia Glacier Melt In Alaska (1986 Vs. 2014)
Images of Change -Via
'Alaska's Columbia Glacier descends through the Chugach Mountains into Prince William Sound. When British explorers surveyed the glacier in 1794, its nose extended to the northern edge of Heather Island, near the mouth of Columbia Bay. The glacier held that position until 1980 when it began a rapid retreat. The glacier has thinned so much that the tides' up and down motion affects its flow as much as 12 kilometers (7.5 miles) upstream until the glacier bed rises above sea level and the ice loses contact with the ocean.'South Dakota’s James River Floods (2015 Vs. 2020)
Images of Change -Via
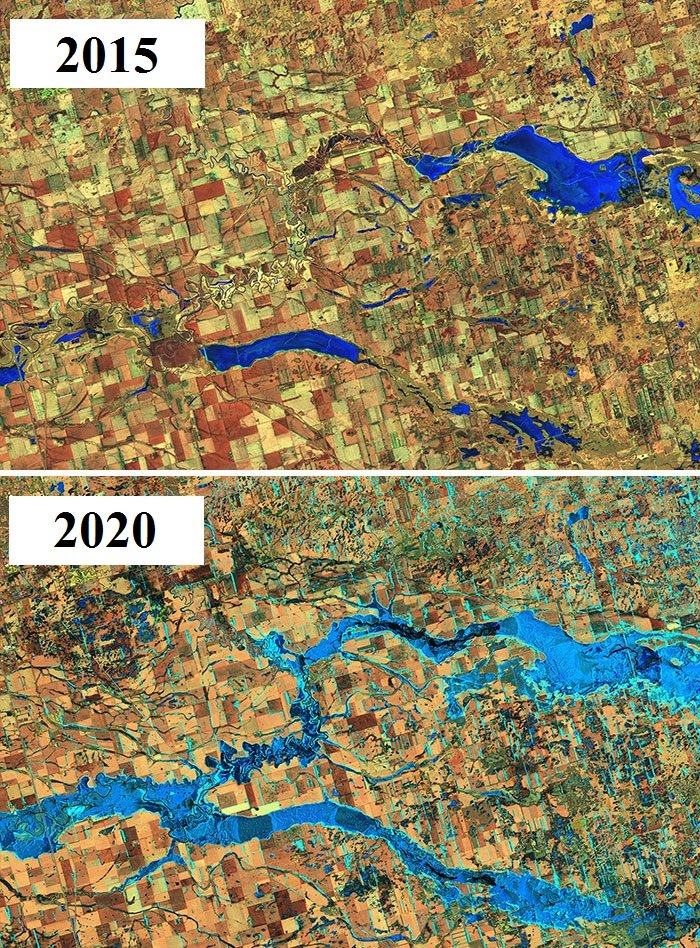
'These images show a portion of the James River in eastern South Dakota. The 2015 image depicts the river in a typical spring, while in the 2020 image, it is overflowing its banks. This and other sections of the river had been at flood level since spring 2019. In these false-color images, ice appears light blue, and water is dark blue. The blue area merging with the James from below is Putney Slough, which also flooded.'The Shrinking Glaciers In New Zealand (1990 Vs. 2017)
Images of Change -Via
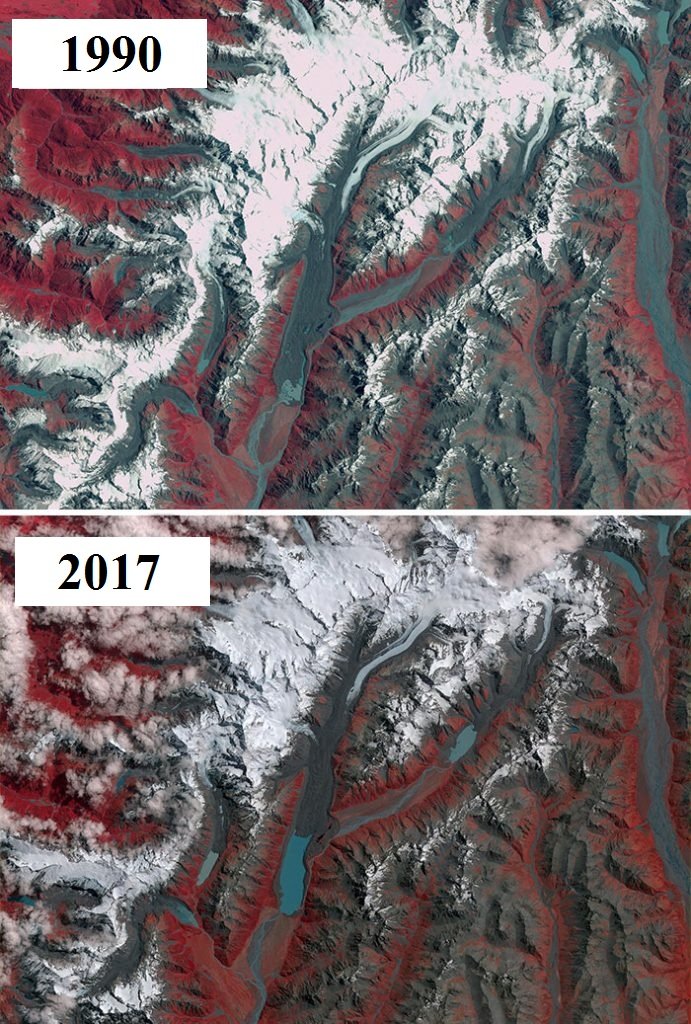
'New Zealand contains over 3,000 glaciers, most of which are on the South Island’s Southern Alps. The glaciers have been retreating since 1890, with short periods of small advances. In 2007, scientists at the country’s National Institute of Water and Atmospheric Research (NIWA) attributed this change to global warming. Without substantial climate cooling, they said, the glaciers would not return to their previous sizes. The differences between 1990 and 2017 can be seen in this pair of images, including the Mueller Glacier, Hooker Glacier, and Tasman Glacier, New Zealand’s longest.'The Shrinking Aral Sea In Central Asia (2000 Vs. 2014)

Images of Change -Via
'The Aral Sea was the fourth-largest lake in the world until the 1960s when the Soviet Union diverted water from the rivers that fed the lake, so cotton and other crops could be grown in the arid plains of Kazakhstan, Uzbekistan, and Turkmenistan. The black outline showed the approximate coastline of the lake in 1960. By the 2000 image, the Northern Aral Sea had separated from the Southern Aral Sea, which itself had split into eastern and western lobes. A dam built in 2005 helped the northern sea recover much of its water level at the southern sea's expense. Dry conditions in 2014 caused the southern sea’s eastern lobe to dry up completely for the first time in modern times. The loss of the moderating influence of such a large body of water has made the region’s winters colder and summers hotter and drier.'


